
Placer.ai Office Index—February 2025 Recap

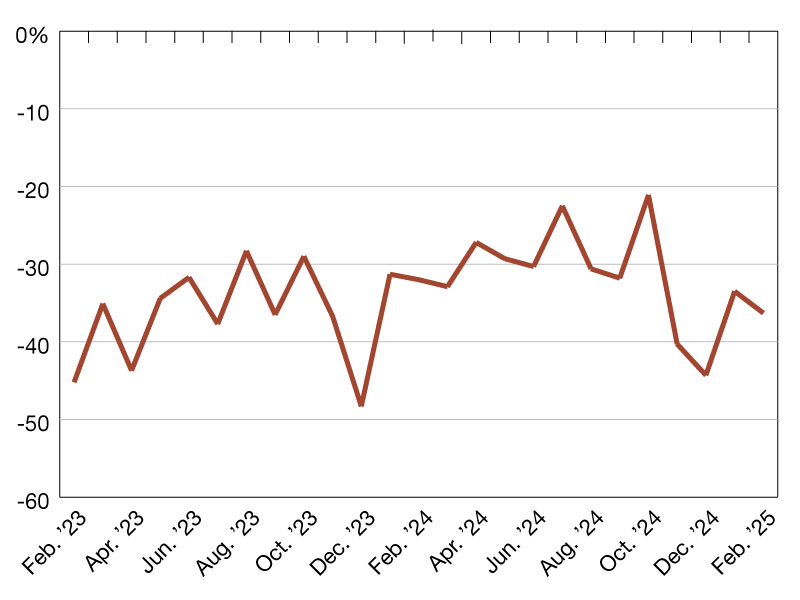
While headlines trumpeting an imminent return to traditional office life fueled by corporate mandates have become increasingly common in recent months, ground-level data reveals a more complex reality. Office building foot traffic indicates that the office recovery has slowed, with February visits down by 36.3 percent compared to pre-pandemic levels in February 2019. This data suggests that despite top-down pressure and return-to-office mandates at several major U.S. companies, hybrid and remote work models remain widespread.
New York and Miami lead the RTO recovery
Diving into the market-level data reveals that the nationwide average office occupancy metric was driven by relatively significant visit gaps across most analyzed cities, with the exception of New York City and Miami that continued to lead the return to office trends, followed by Atlanta. Houston, Washington D.C., and Dallas all experienced year-over-five-year visit gaps of 34.6 percent to 38.4 percent—close to the nationwide average—while the year-over-five-year office visit gaps for Boston, Los Angeles and Denver was 43.5 percent, 45.1 percent and 46.6 percent, respectively.
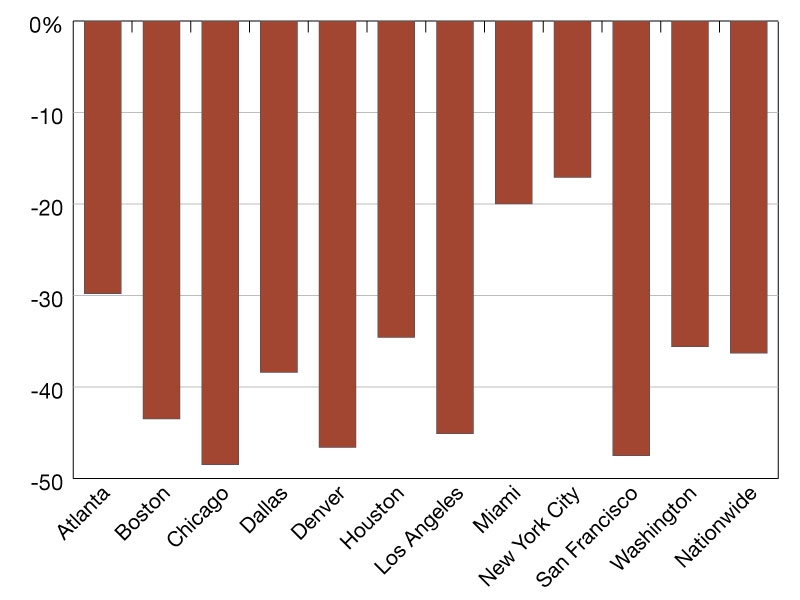
But one metric did stand out in the February data that could hint at a relatively localized return-to-office acceleration. For the first time since we started tracking the post-pandemic office recovery, San Francisco (47.5 percent year-over-five-year visit gap) outperformed Chicago (48.5 percent)—perhaps indicating that RTO mandates in the tech world are beginning to move the needle in the country’s tech capital.
Year-over-year data points to a stalling recovery
The slowing RTO trends also emerge when analyzing the year-over-year data. Although some visit gaps were to be expected given the comparison to a 29 day February in 2024, most cities—with the exception of Miami, Boston and San Francisco—saw a larger dip in office visits than the approximately 3.5 percent visit gap that could be attributed to the calendar shift.
The dip in office visits compared to 2024 suggests that the RTO mandates are not having a significant impact on office occupancy patterns in most major cities and further underscore the enduring impact of remote and hybrid work models.
This blog includes data from Placer.ai Data Version 2.1, which introduces a new dynamic model that stabilizes daily fluctuations in the panel, improving accuracy and alignment with external ground truth sources.
—Posted on March 28, 2025
The post Placer.ai Office Index—February 2025 Recap appeared first on Commercial Property Executive.