DLA Piper Highlights Key CRE Investment Trends

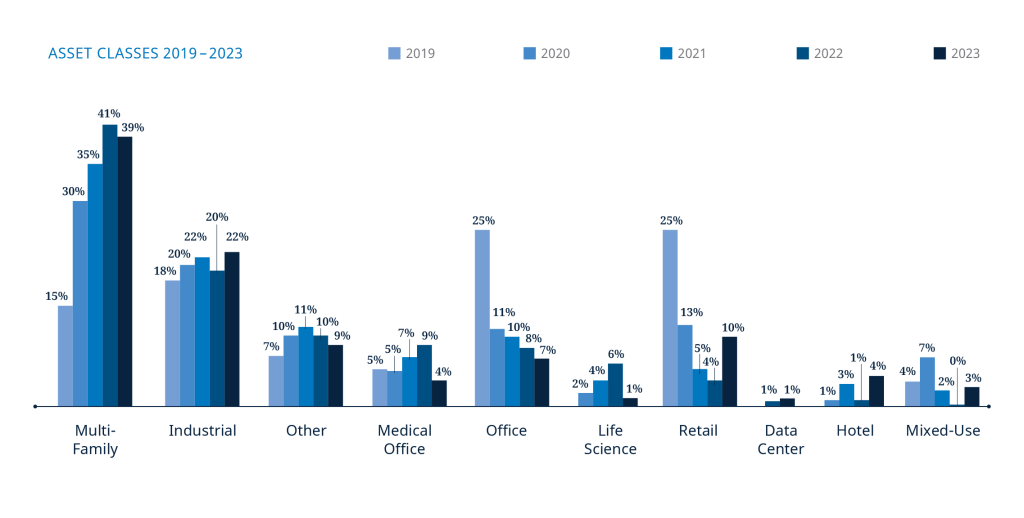
Acquisition and disposition activity as percentages from 2019 to 2023. Image courtesy of DLA Piper
Last year, the commercial real estate industry faced high levels of uncertainty. A whirlwind of rising interest rates, a cooling economy, bank closures and overall volatility made 2023 difficult to navigate. Now, the trends that shaped last year can provide the industry with knowledge of the year ahead.
In terms of acquisition and disposition activity, the asset class that remained most active in 2023 was multifamily, DLA Piper‘s year-end real estate trends report shows. Multifamily assets, which accounted for 39 percent of overall sales, were followed by industrial properties, at 22 percent of the investment activity monitored in the report.
Office space accounted for only 7 percent of total deals, while retail came in at 10 percent, a significant increase from 2021 and 2022 data. Mixed-use developments recorded an increased investment activity, while life science properties saw a notable decline, from 6 percent in 2022 to 1 percent in 2023.
“We saw a significant increase in the purchase of neighborhood and grocery-anchored retail properties,” John Sullivan, chair of the US real estate practice & co-chair of the global real estate sector at DLA Piper told Commercial Property Executive. “We suspect that is likely due, at least in part, to the continuation of hybrid work arrangements. With people spending more time where they live, there is more demand for amenities in those areas.”
Survival periods stay the same
In terms of survival periods for sellers’ representations and warranties, the DLA Piper report found little change from mid-2023 to the end of 2023. The most common period continued to be 270 days, followed by 180 days.
READ ALSO: Why CREFC Survey Says Things Are Looking Up
Considering a less active market, the report shows no big changes between mid-year and year-end average liability caps and baskets for a breach of sellers’ warranties and representations.
Financing contingencies on the rise
As far as financing contingencies in 2023, 92.5 percent of agreements had none. Despite few purchase and sale transactions having these contingencies, the report shows that the number is increasing. From mid-year to end of 2023, there was an almost 2 percent increase in frequency, primarily in the form of loan assumption conditions.
At the end of the year, financing contingencies not in the form of a loan assumption made up 3.5 percent of transactions, compared to 4 percent with loan assumption.
“It’s a matter of relative bargaining positions,” Sullivan said when asked why he believes these contingencies increased in popularity last year. Financing contingencies favor the buyer. Therefore, when recent economic circumstances led to a buyer’s market in 2023, more sellers were willing to agree that the sale could be conditioned by a buyer’s ability to secure financing.
“Conversely, with debt more expensive and harder to obtain, few buyers were willing to risk the loss of their deposits if they were not able to secure financing at an acceptable rate,” Sullivan noted. “Although we expect to continue to see some financing contingencies this year, we expect that they will continue to very much remain the exception rather than the rule.”
Property and construction management
According to the 300 property management agreements analyzed in the DLA Piper Report, there was no significant change in property management fees as a percentage of the property’s revenue from mid-2023 to the end of the year. As a percentage of the cost of the work, construction management fees also saw little change over the same period.
For industrial, life science, multifamily and office assets, the most common property management fee was in the range of 3 percent to 3.99 percent. Data centers and mixed-use developments most commonly had a property management fee in the range of 2 percent to 2.99 percent. Senior housing, life science and medical office buildings often had property management fees higher than 4 percent.
Construction management fees for multifamily and mixed-use properties most commonly represented 5 percent or more of the total cost of the work. For data centers, medical office buildings and life science assets, this percentage fell more often in the range of 2 percent to 5 percent. Contrarily, industrial and senior housing properties most frequently had construction fees in the 2 percent to 2.99 percent range.
One property management trend that did change from the mid-way point of 2023 to the end of the year was the frequency of a liability cap, which decreased from 9.28 percent to 6.23 percent, respectively.
For construction fees, while the percentage of the cost of the work largely did not change, almost 4 percent more fees negotiated by DLA Piper limited the rate to hard costs only at the end of the year, when compared to mid-year fees. Some 31 percent of construction management fees included hard costs only at the end of 2023.
Sullivan said that this change in construction fees is likely a matter relative to bargaining positions, similarly to financing contingencies. “With less construction taking place, there is more competition for the construction management work, which in turn gives owners more bargaining power,” he said.
The post DLA Piper Highlights Key CRE Investment Trends appeared first on Commercial Property Executive.


